Most Dangerous Neighborhoods in Baltimore
Go Back To Previous PageBaltimore is known for its working-class heritage, colonial history, and seafood, but it also carries a reputation for violent crime. That reputation is real, though it’s changed significantly in the last few years — more on that below. As a regional economic and cultural hub, the city has historically experienced higher crime rates than the national average. If you’re considering visiting or moving to Baltimore, here are the 12 neighborhoods worth knowing about, along with the most current citywide data available.
Is Baltimore Dangerous?
This is the single most important update to make to any “dangerous neighborhoods in Baltimore” list written before 2026: Baltimore’s homicide rate has dropped sharply and is now at its lowest level in nearly 50 years.
The city recorded 133- 134 homicides in 2025 — down from 202 in 2024, 263 in 2023, and 334 in 2022 — a roughly 59% decline in homicides over five years, and the largest single-year percentage drop the city has ever recorded. That works out to a murder rate of roughly 23-24 per 100,000 residents in 2025, down from the 36-per-100,000 figure that circulated widely in older articles (including earlier versions of this one). The decline has continued into 2026.
That said, Baltimore’s overall crime rate — which includes property crime, not just homicide — is still elevated compared to the national average. Based on 2023 FBI data (the most recent full reporting year available), Baltimore’s total crime rate runs around 5,763 incidents per 100,000 residents, about 172% higher than the national rate of roughly 2,119 per 100,000.
In summary: Baltimore remains one of the more dangerous cities in the United States by overall crime rate, but its most serious violent crime — homicide — has fallen to a historic low, and that trend deserves equal billing with the city’s older reputation.
1. Middle East
Middle East, in East Baltimore, has ranked as one of the city’s most dangerous neighborhoods in multiple crime-data surveys.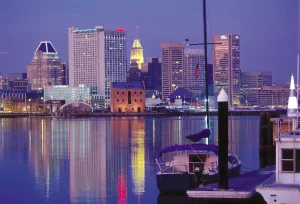 Despite sitting next to Johns Hopkins Medical Center, the area of roughly 7,100 residents has seen significant urban decay, with entire blocks nearly abandoned.
Neighborhood-level crime data is inherently harder to keep current than citywide figures (no publisher has run a fresh neighborhood-by-neighborhood survey recently); the most consistently cited figures, sourced from FBI and AreaVibes data from 2020-2023, put its crime rate around 10,945 incidents per 100,000 people, roughly 445% above the Maryland state average, driven by both high property crime and violent crime.
2. Fairfield
Fairfield, along I-895, is one of Baltimore’s smallest and, per 2020-2023 vintage FBI/AreaVibes data, most dangerous neighborhoods — just 530 residents, but a crime rate cited at 391% above the Maryland state average.
Severe poverty, urban decay, and a lack of basic services compound the problem; the violent crime rate, specifically, is cited at 667% above the national average in that same dataset.
3. West Baltimore
West Baltimore sits close to the University of Maryland’s downtown campuses. Per 2020-2023 vintage crime data, its crime rate runs about 350% above the national average — among the highest of any neighborhood in this list.
Underfunded schools, limited employment, and high poverty rates persist despite recent renovation efforts, and the neighborhood remains among the city’s more challenged areas.
4. East Monument Historic District
East Monument Historic District carries a genuinely significant past — a Bohemian artistic community in the early 20th century, deep roots in European immigration and African American culture, and a spot on the National Register of Historic Places.
Its present has real challenges too: cited violent crime data (2020-2023 vintage) runs about 317% above the national average.
5. Pulaski
Pulaski has just 475 residents but a crime rate cited at roughly 307% above the national average (2020-2023 vintage data), compounded by limited access to education and employment.
The neighborhood is also home to the National Aquarium, though visitors are generally advised to stay within the immediate complex rather than wander further.
6. Cherry Hill
Cherry Hill, home to one of Baltimore’s largest public housing developments, has a crime rate around 291% above the state average, with persistent gang activity, violent crime, and drug trafficking historically reported in the area.
Poverty runs deep here — the average home price is just $74,538.
7. Greenmount East
Greenmount East, population 11,041, has a crime rate around 277% above the national average, with historically high rates of burglary, theft, and gang-related violence.
Residents have reported feeling under-protected by local police, and walking through the neighborhood is generally not recommended.
8. Highlandtown
Highlandtown has a genuinely community-oriented feel — brick row houses, local pubs, proximity to Patterson Park and the Creative Alliance Theater — alongside crime statistics that stand in contrast to that reputation.
Cited figures put its total crime rate around 209% above the national average, with violent crime around 567% above the national average in the same 2020-2023 vintage dataset.
9. Greater Rosemont
Greater Rosemont, population 18,664, is among Baltimore’s more neglected and underserved neighborhoods, with a cited crime rate around 202% above the national average.
Building conditions are a real concern here too — some structures have been dilapidated enough that collapses have caused injuries and fatalities among residents.
10. Berea
Berea, in the East District, is a historic neighborhood of affordable row houses on grassy plots, bordered by US Route 40 and Edison Highway with easy access to downtown.
Cited crime data puts its overall rate around 195% above the national average, with violent crime specifically around 570% above the national average.
11. Grove Park
Grove Park, with a population of 1,872, has a crime rate cited at around 187% above the Maryland statewide average.
New housing construction has brought some recent investment, but much of the neighborhood still shows the effects of long-term urban decay.
12. Sandtown-Winchester
Sandtown-Winchester, in West Baltimore, has an unemployment rate historically nearly double the city’s average, with many residents living below the poverty line.
Drug trafficking, gang activity, and property theft have been persistent issues, and the neighborhood carries additional historical weight as the site of the 2015 Freddie Gray riots.
Baltimore Crime Data at a Glance
| Metric | Figure | Data As Of |
|---|---|---|
| Citywide homicides | 133–134 | 2025 (record low) |
| Citywide murder rate | ~23–24 per 100,000 | 2025 |
| Citywide overall crime rate | ~5,763 per 100,000 (~172% above national) | 2023 FBI data |
| 5-year homicide trend | Down ~59% since 2021 | 2021–2025 |
Sources: Baltimore City Mayor’s Office (January 2026 press release on 2025 crime data), FBI Crime Data Explorer. Neighborhood-level figures above are cited to FBI/AreaVibes data from 2020-2023, the most recent neighborhood-level breakdown publicly available at the time of writing.
FAQ
Is Baltimore’s crime rate improving?
Yes, significantly on the homicide front. 2025 recorded the fewest homicides in Baltimore in nearly 50 years, continuing a five-year decline. Overall crime (including property crime) remains elevated versus the national average, but the trend in violent crime specifically has been strongly positive.
What is Baltimore’s murder rate?
Approximately 23- 24 per 100,000 residents as of 2025 — down from roughly 36 per 100,000 in earlier years. This is Baltimore’s lowest murder rate since 1977.
Are all of Baltimore’s neighborhoods dangerous?
No. Crime in Baltimore, like in most cities, is concentrated in specific neighborhoods rather than evenly distributed. The neighborhoods listed above represent some of the highest-crime areas by available data; many other Baltimore neighborhoods have crime rates at or below the national average.
Where can I find current Baltimore crime data?
The Baltimore Police Department maintains a live crime map and weekly ComStat reports at baltimorepolice.org, which will always be more current than any static list, including this one.
For similar looks at cities with comparable recent crime trends, see our guides to Detroit and Portland.



Georges has been working in Wall Street for the last 16 years trading derivatives with hedge funds. He has been an active real estate investor for over a decade. Georges graduated from HEC Business School in Paris and holds a master in Finance from ESADE Barcelona.