Most Dangerous Neighborhoods in Portland, Oregon
Go Back To Previous PagePortland, Oregon, is known for food trucks, a thriving arts scene, and mountain views — and it’s carried a heavy reputation for crime and homelessness in recent years. That reputation is genuinely mixed right now: violent crime has fallen sharply since 2022, while homelessness has continued to rise. Both are true at once, and a fair picture needs both.
Is Portland Safe? Violent Crime Is Down, Property Crime Isn’t
Portland’s homicide count has dropped for three straight years: 96 in 2022, 73 in 2023, roughly 67-68 in 2024, and 51-52 in 2025 — close to a 50% decline from the 2022 peak. The first half of 2025 alone saw homicides fall 51% year-over-year, the steepest drop of any major U.S. city tracked in the Major Cities Chiefs Association’s 68-city report; overall violent crime fell 17% in that same window, with aggravated assault down 18% and robbery down 10%.
The honest caveat: Portland’s homicide rate, even after this decline, remains higher than San Francisco’s or New York City’s. And property crime — the category that drives a lot of the day-to-day “is this neighborhood safe” feeling — has not seen the same improvement; Portland still posts one of the higher property crime rates among major U.S. cities.
Third-party safety percentile rankings (the kind that produce a single number like “35th percentile” or “1st percentile”) vary widely between providers and data vintages, so we’re deliberately not citing one here — the Portland Police Bureau’s own published data is the more reliable source for current trends.
Homelessness: A Real, Still-Growing Factor
Homelessness remains a significant driver of neighborhood-level conditions across Portland. The 2025 Tri-County Point-in-Time Count found 12,034 people experiencing homelessness across the Portland metro area, a 61% increase from 2023.
Portland State University researchers and county officials note that part of this increase reflects improved counting methodology (new data sources and expanded outreach that made previously undercounted people visible), not solely a proportional rise in people becoming homeless — but eviction filings also genuinely increased over the same period (up 33% in Multnomah County, 63% in Washington County), which is independent evidence of real, rising housing precarity, not just a counting artifact.
1. Lents
Lents, in southeast Portland, has historically ranked as one of the city’s higher-crime neighborhoods despite a genuinely lively mix of bars, restaurants, theaters, and shops,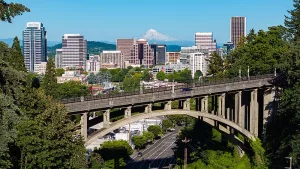 plus green space like Lents Park, the Beggars Tick Wildlife Refuge, and Pickles-Walker Stadium, home of the Portland Pickles.
Per the most recently available neighborhood-level data, its total crime rate ran 42% above the rest of Portland and 331% above the national average, with violent crime 188% above the national average.
2. Hazlewood
Hazlewood, Portland’s second-largest neighborhood, spans 2,500 acres in the eastern part of the city and features tree-lined streets, spacious homes, and green spaces like Ventura Park and the Glendoveer Nature Exercise Trails.
Per the most recently available data, its overall crime rate was 36% above Portland’s average and 313% above the national average; violent crime, specifically, was 175% above the national average.
3. Sunderland
Sunderland, near Columbia Boulevard and Portland International Airport, has a small population but a crime rate 259% above the national average, with drug trafficking a persistent problem historically.
4. Lloyd District
Lloyd District, near downtown Portland and the Broadway Bridge, is shifting from an industrial past toward a more residential future, with new shops and restaurants moving in.
Cited crime data ran 247% above the national average, with vehicle theft, burglary, and other property crimes among the most common offenses historically.
5. Centennial
Centennial, with a population of approximately 20,932, had a crime rate 234% above the national average, driven historically by drug trafficking and property crime.
6. Powellhurst
Powellhurst had a crime rate 228% above the national average, with homelessness contributing to property crime and drug use in the area historically. Violent crime ran 96% above the national average in the same dataset.
7. Bridgeton
Bridgeton, along the Columbia River directly across from Vancouver, has had a significant homeless population and numerous encampments. Despite a small population, its cited crime rate ran 211% above the national average, with property crime the most common issue.
8. Mill Park
Mill Park, in East Portland, has had a significant homeless population and a crime rate cited at 207% above the national average historically.
9. Parkrose
Parkrose, between highways 205 and 84, had a crime rate 204% above the national average, driven mainly by property crime, with homelessness and drug activity as ongoing challenges.
10. Kenton
Kenton, in northwest Portland, had a crime rate 171% above the national average, with car theft, burglary, and larceny historically the most common property crimes. Some parts of the neighborhood have seen recent revitalization.
11. St. John’s
St. Johns has been in genuine transition — new stores, parks, and homes have moved in, though several parks have historically seen criminal activity and theft has been common on the neighborhood’s outskirts.
12. Chinatown
Chinatown remains a popular tourist destination, but it has historically also been one of Portland’s higher-crime neighborhoods, and visitors should stay alert. Robbery, assault, and pickpocketing have been reported regularly, often targeting tourists specifically; property crime has historically been more common than violent crime.
Portland Crime Data at a Glance
| Metric | Figure | Data As Of |
|---|---|---|
| Citywide homicides | ~51–52 | 2025 (down from 96 in 2022) |
| H1 2025 homicide change | -51% YoY | First half 2025 vs. first half 2024 |
| H1 2025 violent crime change | -17% YoY | First half 2025 |
| Property crime | Still elevated vs. national average | Most recent available |
| Tri-county homeless population | 12,034 (+61% vs. 2023, partly methodology-driven) | 2025 Point-in-Time Count |
Sources: Portland Police Bureau 2025 Annual Report, City of Portland (Mayor’s Office, August 2025 release), Major Cities Chiefs Association, PSU Homelessness Research and Action Collaborative. Neighborhood-level figures reflect the most recent breakdown available at the time of writing.
FAQ
Is Portland’s crime rate improving?
Violent crime and homicides specifically, yes — homicides are down roughly 50% from the 2022 peak, and Portland posted the steepest homicide-rate drop of any major U.S. city in the first half of 2025. Property crime has not improved at the same rate and remains elevated.
Is homelessness in Portland getting worse?
By the 2025 count, yes — 12,034 people counted tri-county-wide, up 61% from 2023. Researchers note part of that increase reflects better counting methodology, but rising eviction filings over the same period point to genuine, growing housing precarity as well.
Is Portland safer than a few years ago?
On violent crime, meaningfully yes. On property crime and homelessness, the picture is more mixed. A fair answer depends on which kind of safety you’re asking about.
For similar looks at cities with comparable recent crime trends, see our guides to Baltimore, Detroit, and Seattle.



Georges has been working in Wall Street for the last 16 years trading derivatives with hedge funds. He has been an active real estate investor for over a decade. Georges graduated from HEC Business School in Paris and holds a master in Finance from ESADE Barcelona.
